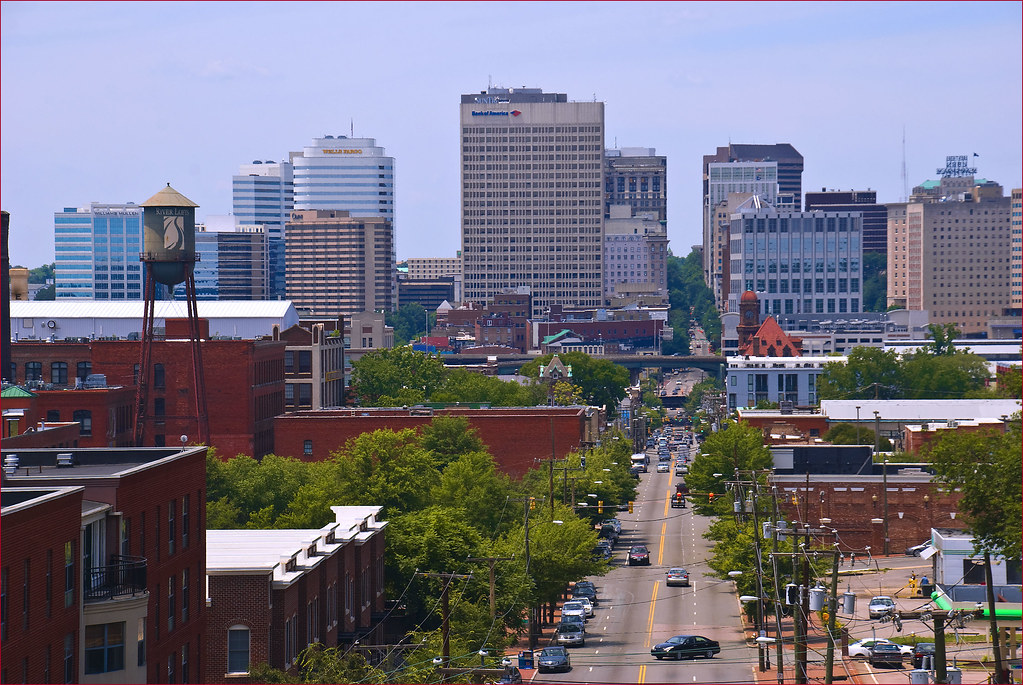
Richmond, Virginia, nestled amidst its historical marvels and cultural tapestry, beckons with promises of an enriching lifestyle. However, the allure of this vibrant city isn’t just about its heritage or attractions; it’s also about its affordability. The cost of living plays a pivotal role in the decision to make this city home. Here’s a comprehensive exploration of Richmond’s cost of living, providing insights to aid your relocation considerations.
Richmond, VA Cost of Living Index

Understanding the nuances of living expenses in Richmond begins with delving into the Cost of Living Index (COLI). Discover how Richmond’s index stands at 94.9, making it approximately 5.1% more affordable than the national average. Uncover specifics on housing, groceries, and transportation costs, offering a clear perspective on the financial landscape.
As of the third quarter of 2023, Richmond, VA’s overall cost-of-living index is 94.9. This means it’s approximately 5.1% more affordable than the U.S. national average. Here’s a breakdown of how individual categories stack up:
- Groceries: 100.4 (slightly above the national average);
- Miscellaneous goods and services: 100.1 (close to the national average);
- Utilities: 98.9 (slightly below the national average);
- Health care: 96.9 (below the national average);
- Transportation: 94.7 (significantly below the national average);
- Housing: 84.1 (significantly below the national average).
Key takeaways:
- Housing is the most significant driver of Richmond’s affordability, with average rental and home prices being notably lower than the national average;
- Transportation costs are also quite reasonable, making commutes less expensive;
- Groceries and miscellaneous goods and services are fairly similar to the national average in terms of cost;
- Health care and utilities are slightly less expensive than the national average in Richmond.
Overall, Richmond offers a cost-of-living index that’s lower than the national average, making it a relatively affordable city to live in. However, it’s worth noting that individual expenses can vary significantly depending on factors like lifestyle, neighborhood, and housing choices.
Here are some resources for further information:
- Axios – Richmond, Virginia’s cost of living is cheaper than U.S. average: https://www.axios.com/local/richmond/2023/11/15/cost-of-living-richmond-virginia-rent-home-prices;
- RentCafe – Cost of Living in Richmond, VA: https://www.rentcafe.com/average-rent-market-trends/us/va/richmond/;
- OnTheFlyMovingGuys – Richmond VA Cost of Living | [2023] Is Richmond VA Affordable?: https://www.bestplaces.net/cost_of_living/city/virginia/richmond.
Cost Breakdown in Richmond

Dive into a detailed breakdown of expenses in Richmond – housing, transportation, food, insurance, and healthcare – to gauge how it compares to the national averages. Gain insights into essential costs and their impact on your budget.
Sure, here’s a breakdown of the average cost of living in Richmond, VA for 2023:
Housing:
- Median rent: $1,200 (1-bedroom apartment);
- Median home price: $325,000;
- Utilities: $165 per month (including electricity, water, and garbage).
Transportation:
- Monthly transit pass: $60;
- Gas: $3.50 per gallon;
- Car insurance: $1,200 per year.
Food:
- Groceries: $300 per month;
- Dining out: $150 per month.
Other expenses:
- Healthcare: $300 per month;
- Phone: $60 per month;
- Internet: $60 per month.
Total:
The average cost of living for a single person in Richmond is approximately $3,000 per month. This number can vary depending on your lifestyle and choices, such as whether you own or rent your home, how much you commute, and how often you eat out.
Here are some additional things to keep in mind:
- The cost of living can vary significantly depending on the neighborhood you live in;
- Taxes in Richmond are relatively low compared to other parts of the country;
- There are many free and low-cost activities to enjoy in Richmond, such as visiting museums, parks, and historical sites.
Overall, Richmond is a relatively affordable city to live in. If you’re looking for a city with a vibrant culture, plenty of things to do, and a lower cost of living than many other major cities, Richmond is a great option.
Cost of Groceries, Food, Gas & Household Items in Richmond

Explore the everyday expenses in Richmond, from grocery prices to utility bills, presenting a practical snapshot of the city’s living expenses.
Groceries:
- Average monthly grocery budget for a single person: $300;
- Milk (1 gallon): $3.50;
- Bread (1 loaf): $2.50;
- Eggs (1 dozen): $2.00;
- Chicken breast (1 lb): $4.00;
- Apples (1 lb): $2.00;
- Potatoes (5 lb bag): $3.00;
- Coffee (1 lb): $8.00.
Food:
- Average cost of a casual restaurant meal: $15;
- Average cost of a coffee shop beverage: $5;
- Average cost of a fast food meal: $8.
Gas:
- Average gas price per gallon: $3.50.
Household Items:
- Toilet paper (12-pack): $5;
- Paper towels (12-pack): $4;
- Laundry detergent (64 oz): $8;
- Dish soap (24 oz): $3;
- Trash bags (50-pack): $8;
- Light bulbs (4-pack): $5.
Tips for Saving Money on Groceries, Food, Gas & Household Items in Richmond:
- Shop at discount grocery stores: There are several discount grocery stores in Richmond, such as Aldi and Lidl, which offer lower prices on many items;
- Plan your meals and make a grocery list: This will help you avoid impulse purchases and stick to your budget;
- Cook at home more often: Eating out can be expensive, so try to cook at home more often;
- Use coupons and promo codes: There are many coupons and promo codes available online and in grocery store flyers;
- Buy in bulk: If you have the space, buying in bulk can save you money on some items;
- Consider using public transportation or carpooling: This can help you save money on gas;
- Look for deals on household items: Many stores have weekly or monthly deals on household items.
By following these tips, you can save money on groceries, food, gas, and household items in Richmond.
Richmond, VA Housing Market
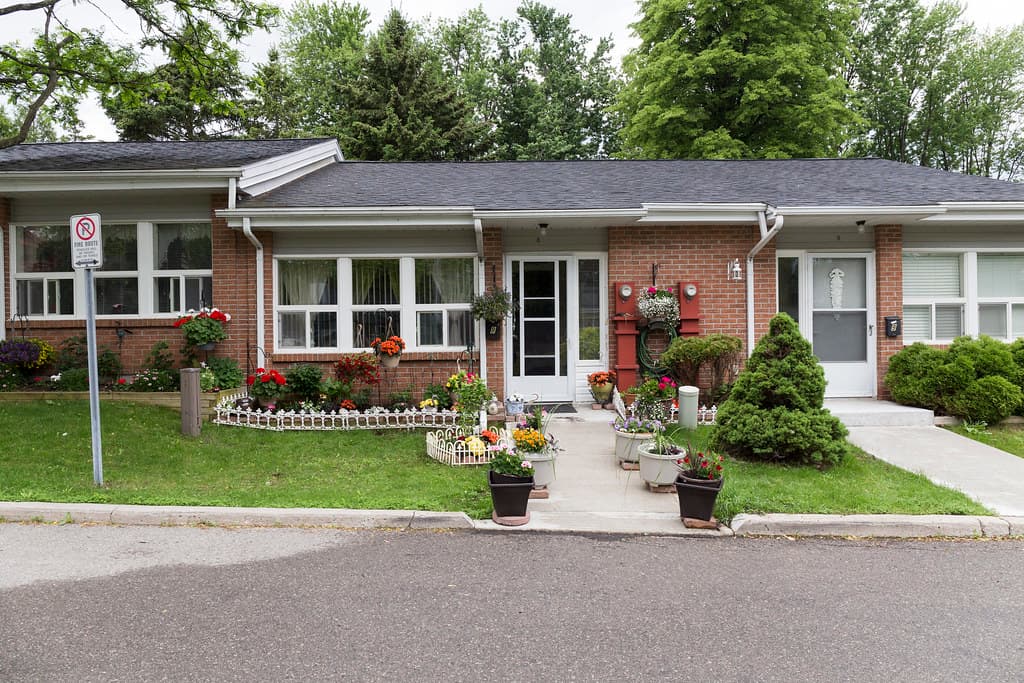
Discover the thriving housing market in Richmond – soaring home prices, market conditions, and the evolving dynamics for buyers and sellers alike. Get a glimpse into the challenges faced by first-time homebuyers and the available support programs.
The Richmond, VA housing market continues to be a dynamic and relatively affordable one compared to the national average. Here’s a breakdown of the current cost situation:
Median home price:
- Overall: $340,000 (as of November 2023);
- Range: $200,000 to $700,000+ depending on factors like location, size, and property type.
Median rent:
- Overall: $1,425 (as of December 2023);
- Range: $800 to $2,500+ depending on factors like apartment size, location, and amenities.
Recent trends:
- Home prices: Up 4.5% year-over-year and trending slightly upwards;
- Rents: Up 3% in the last month but down 5% compared to last year;
- Market: Generally competitive, with homes receiving an average of 3 offers and selling quickly.
Factors influencing cost:
- Location: Desirable neighborhoods like Carytown and Museum District tend to have higher prices;
- Property type: Single-family homes are typically more expensive than condos or apartments;
- Size: Larger homes and apartments naturally cost more;
- Amenities: Properties with desirable features like pools, gyms, or rooftop terraces can command higher prices.
Overall, Richmond offers a relatively affordable housing market compared to many other major cities. However, it’s important to remember that costs can vary significantly depending on your specific needs and preferences.
Here are some additional resources that you may find helpful:
- Redfin Richmond Housing Market: https://www.redfin.com/city/17149/VA/Richmond/housing-market
- Realtor.com Richmond Housing Market: https://www.realtor.com/realestateandhomes-search/Richmond_VA/overview
- Rocket Homes Richmond Housing Market: https://www.rockethomes.com/va/richmond
Richmond Rental Market
Delve into Richmond’s rental market, understanding the surging rental prices, average rents, and the affordability factor for renters. Uncover viable options within varied neighborhoods. The Richmond rental market offers a good mix of affordability and vibrant city life. Here’s a breakdown of the current cost situation:
Median Rent:
- Overall: $1,425 (as of December 2023);
- Range: $800 to $2,500+ depending on factors like apartment size, location, and amenities.
Recent Trends:
- Rents peaked in July 2023 at $1,495 but have since dipped slightly;
- The market remains competitive, with apartments typically receiving multiple applications.
Factors Influencing Cost:
- Location: Desirable neighborhoods like Carytown and The Fan tend to have higher rents;
- Apartment size: Studios are naturally cheaper than two-bedroom or larger units;
- Amenities: Buildings with desirable features like pools, gyms, or rooftop terraces can command higher rents;
- Age and condition: Newer or renovated apartments typically rent for more than older buildings.
Here’s a quick look at average rents by apartment size:
- Studio: $1,137;
- One-bedroom: $1,286;
- Two-bedroom: $1,439;
- Three-bedroom: $1,790.
Tips for Finding Affordable Rentals in Richmond:
- Be flexible with your location: Consider neighborhoods outside of the downtown core for cheaper options.
- Look for smaller apartments: A studio or one-bedroom may be more budget-friendly than a larger unit.
- Consider older buildings: Older buildings may be less expensive than newer ones, even if they have fewer amenities.
- Shop around and compare prices: Don’t be afraid to negotiate with landlords.
Here are some additional resources that you may find helpful:
- Apartment List Richmond Rent Report: [https://www.apartmentlist.com/rent-report/va/richmond];
- Zillow Richmond Rental Market: [https://www.zillow.com/rental-manager/market-trends/richmond-va/];
- RentCafe Richmond Rental Market: [https://www.rentcafe.com/average-rent-market-trends/us/va/richmond/].
Average Salary in Richmond
Assess the average salary and household income in Richmond, offering a comparative analysis against national averages. Gain an understanding of earning potential in the city.
Determining the average salary in Richmond depends on several factors, including:
- Your industry or field: Salaries vary significantly across different industries. For example, healthcare professionals typically earn more than retail workers;
- Your level of experience: More experienced workers generally earn higher salaries than those with less experience;
- Your education level: Those with higher education levels often earn more than those with lower levels of education;
- Your employer: Some companies offer higher salaries than others.
Therefore, stating a single “average salary” for Richmond might not be the most accurate information. However, here are some insights to help you understand the salary landscape:
- ZipRecruiter (December 2023): The average annual salary in Richmond is $69,315. The 25th percentile is $50,156, and the 75th percentile is $84,172. This indicates that most salaries fall within the range of $50,000 to $84,000;
- Payscale (November 2023): The median annual salary in Richmond is $56,154. However, some companies offering higher average salaries include Capital One Financial Corp. ($96,472), GlaxoSmithKline ($100,000), and VCU Health Systems ($70,829).
Additional resources:
- Bureau of Labor Statistics: You can find detailed wage data for specific occupations and industries in Richmond on the Bureau of Labor Statistics website: https://www.bls.gov/;
- Salary.com: Salary.com offers a salary calculator that can help you estimate your earning potential based on your occupation, experience, and location: https://www.salary.com/.
To get a more accurate understanding of the average salary in your specific field and experience level, I recommend using these resources or searching for salary data directly related to your desired job title in Richmond.
Income, Sales & Property Taxes in Richmond, VA
Richmond, VA, boasts a relatively lower tax burden compared to many other major cities. Here’s a breakdown of the main taxes you’ll encounter:
Income Tax:
- State Income Tax: Virginia has a flat income tax rate of 5.75% for all income levels;
- Local Income Tax: Richmond does not have an additional local income tax.
Sales & Use Tax:
- State Sales Tax: Virginia has a state sales tax of 4%;
- Local Sales Tax: Richmond has a local sales tax of 1%, bringing the total sales tax to 5%;
- Exemptions: Certain items like food for home consumption and some medical supplies are exempt from sales tax.
Property Tax:
- Property taxes are assessed by the city and county and vary depending on the property’s value and location;
- The average effective property tax rate in Richmond is around 1.05%, which is lower than the national average.
Additional Taxes:
- Cigarette Tax: Virginia has a cigarette tax of $0.50 per pack;
- Alcohol Tax: Virginia has varying taxes on alcohol depending on the type and proof;
- Gas Tax: Virginia has a gas tax of 16.8 cents per gallon.
Resources for further information:
- Virginia Department of Taxation: [https://www.tax.virginia.gov/];
- City of Richmond Department of Finance: [https://rva.gov/finance].
Tips for Reducing Your Tax Burden:
- Claim all available deductions and credits on your income tax return;
- Consider buying energy-efficient appliances and making home improvements to qualify for property tax credits;
- Shop around for insurance and other services to find the best rates.
Remember, this is just a general overview. The specific taxes you pay will depend on your individual circumstances. It’s always best to consult with a tax professional for personalized advice.
Richmond, VA vs Raleigh, NC Cost of Living
Comparing the cost of living between Richmond, VA and Raleigh, NC can be helpful if you’re considering a move to either city. Here’s a breakdown of key factors in 2023:
Overall:
- Raleigh is slightly more expensive than Richmond: Studies put Raleigh’s cost of living around 3-10% higher than Richmond’s;
- However, the gap varies depending on specific expenses: Housing is notably more expensive in Raleigh, while groceries and utilities might be similar or slightly cheaper than in Richmond.
Here’s a breakdown of specific categories:
Housing:
- Median home price: Raleigh: $384,000 | Richmond: $325,000;
- Median rent: Raleigh: $1,510 | Richmond: $1,283.
Transportation:
- Gas prices: Similar in both cities;
- Public transportation: Raleigh has a more extensive bus system, while Richmond offers light rail. Costs are comparable.
Food & Groceries:
- Groceries: Similar costs in both cities;
- Dining out: Costs are similar, although Raleigh might have slightly more high-end dining options.
Utilities:
- Cost of utilities: Similar in both cities.
Other:
- Sales tax: Richmond has a lower combined sales tax (5%) than Raleigh (6.8%);
- Income tax: Both states have a flat income tax rate, with Virginia slightly lower (5.75%) than North Carolina (5.25%).
Tips for choosing between Richmond and Raleigh:
- Consider your priorities: If housing is a major concern, Richmond might be the more affordable option. If you value access to public transportation or an extensive job market, Raleigh might be a better fit;
- Do your research: Compare specific costs in the neighborhoods you’re considering;
- Factor in your lifestyle: Consider how much you spend on things like dining out, entertainment, and hobbies.
Ultimately, the best city for you depends on your individual needs and preferences. Weighing the cost of living alongside other factors like job opportunities, culture, and climate can help you make an informed decision.
Conclusion
Richmond, VA stands as an alluring option, not just for its affordability but also for the robust quality of life it offers. A mosaic of history, culture, and opportunity awaits those who choose to call this city home.